Traditionally voice analysis has been done by ear at a subjective auditory-perceptual level. The three main characteristics of voice are: pitch – normal for age and gender, too high or too low; loudness – normal, too high or too low; and voice quality – ‘hoarseness’.
Objective acoustic analysis is the extraction of acoustic, prosodic (rhythm and intonation) and linguistic information from the voice signal and is used in a wide range of fields including healthcare (e.g. quantitative analysis of the voice, detection of voice pathology, monitoring of response to treatment), forensics (speaker identification) and business applications (e.g. speaker authentication, fraud detection, market research). In clinical practice and research, objective measures of the voice are obtained using signal processing of the acoustic signal radiating from the mouth. Complementary information about the sound source can be obtained from an electroglottographic (EGG) signal obtained using electrodes placed on the neck over the larynx. Software programs are used to analyse a steady part of a sustained vowel at a comfortable pitch, with increasing attention being paid to the analysis of connected speech, which is more relevant to human communication.
Analysis of sustained vowels is often reported in a ‘multidimensional voice profile’, providing information on the frequency and regularity of vocal fold vibration (e.g. fundamental frequency (F0) in Hz, jitter, shimmer), the overall loudness (sound pressure level [SPL] in dB) and the relative sound energy in the harmonic and noise components (e.g. harmonics-to-noise ratio). Auditory-perceptual rating scales such as GRBAS further characterise hoarseness into four dominant components: roughness (R), breathiness (B), asthenia (A) and strain (S). Each is rated in severity from 0–3, with ‘G’ also rated in terms of overall grade of hoarseness. Although simple to use and with good interrater reliability for normal and severely dysphonic voices, it is less reliable for mild to moderate dysphonia. In addition, there is generally poor correlation between these perceptual abnormalities and objective measures, which raises the question of their relevance to patients and to clinical assessment and management [1].
Newer and/or more clinically useful approaches make more use of connected speech and include: cepstral analysis, multiparametric assessments, utilising synchronously acquired EGG signals, and machine-learning methods of artificial intelligence (AI).
Cepstral analysis
Cepstral peak prominence (CPP) and its smoothed variant CPPS measured in decibels (dB) are non-linear signal-processing techniques used to separate the effects of the excitation source generated by the vocal cords from the resonance effects of the vocal tract. They quantify the degree of harmonic organisation within a voice signal, reflecting periodicity and vocal stability. They can be measured on both sustained vowels and speech samples, and can be used in severely dysphonic voices. Lower values correlate well with severe dysphonia and are highly sensitive to changes in voice quality. CPP values depend on speaker characteristics such as sex, age, language, vocal effort and pitch, and may also be influenced by factors including speech task and recording conditions. Therefore, between- and within-speaker comparisons should be made using the same vowels and speech material, under identical recording conditions and with the same software [2].
Multiparametric measures
Multiparametric acoustic voice indices (MAVIs), including the Acoustic Voice Quality Index (AVQI) for assessing dysphonia severity and the Acoustic Breathiness Index (ABI) for assessing breathiness, have gained popularity owing to the availability of open-access, easy-to-use smartphone software. AVQI combines six acoustic parameters, while ABI combines nine, and both include CPP as a core component. Analysis is based on three seconds of a sustained mid-vowel [a:], as in ‘far’~~ and~~ , and 22 syllables of connected speech from a phonetically balanced read text, e.g. ‘The Rainbow Passage’. Weighted scores give values between 0 and 10, with higher values indicating rougher and breathier voices respectively. Both demonstrate strong correlations with perceptual ratings of dysphonia severity and are robust across multiple languages and populations, independent of age and gender. AVQI thresholds have also been shown to effectively discriminate between healthy and disordered voices, with a diagnostic accuracy of over 80%. When combined with responses from patient questionnaires such as the Voice Handicap Index or Glottal Function Index, they are showing promise for dysphonia screening and as objective outcome measures [3].
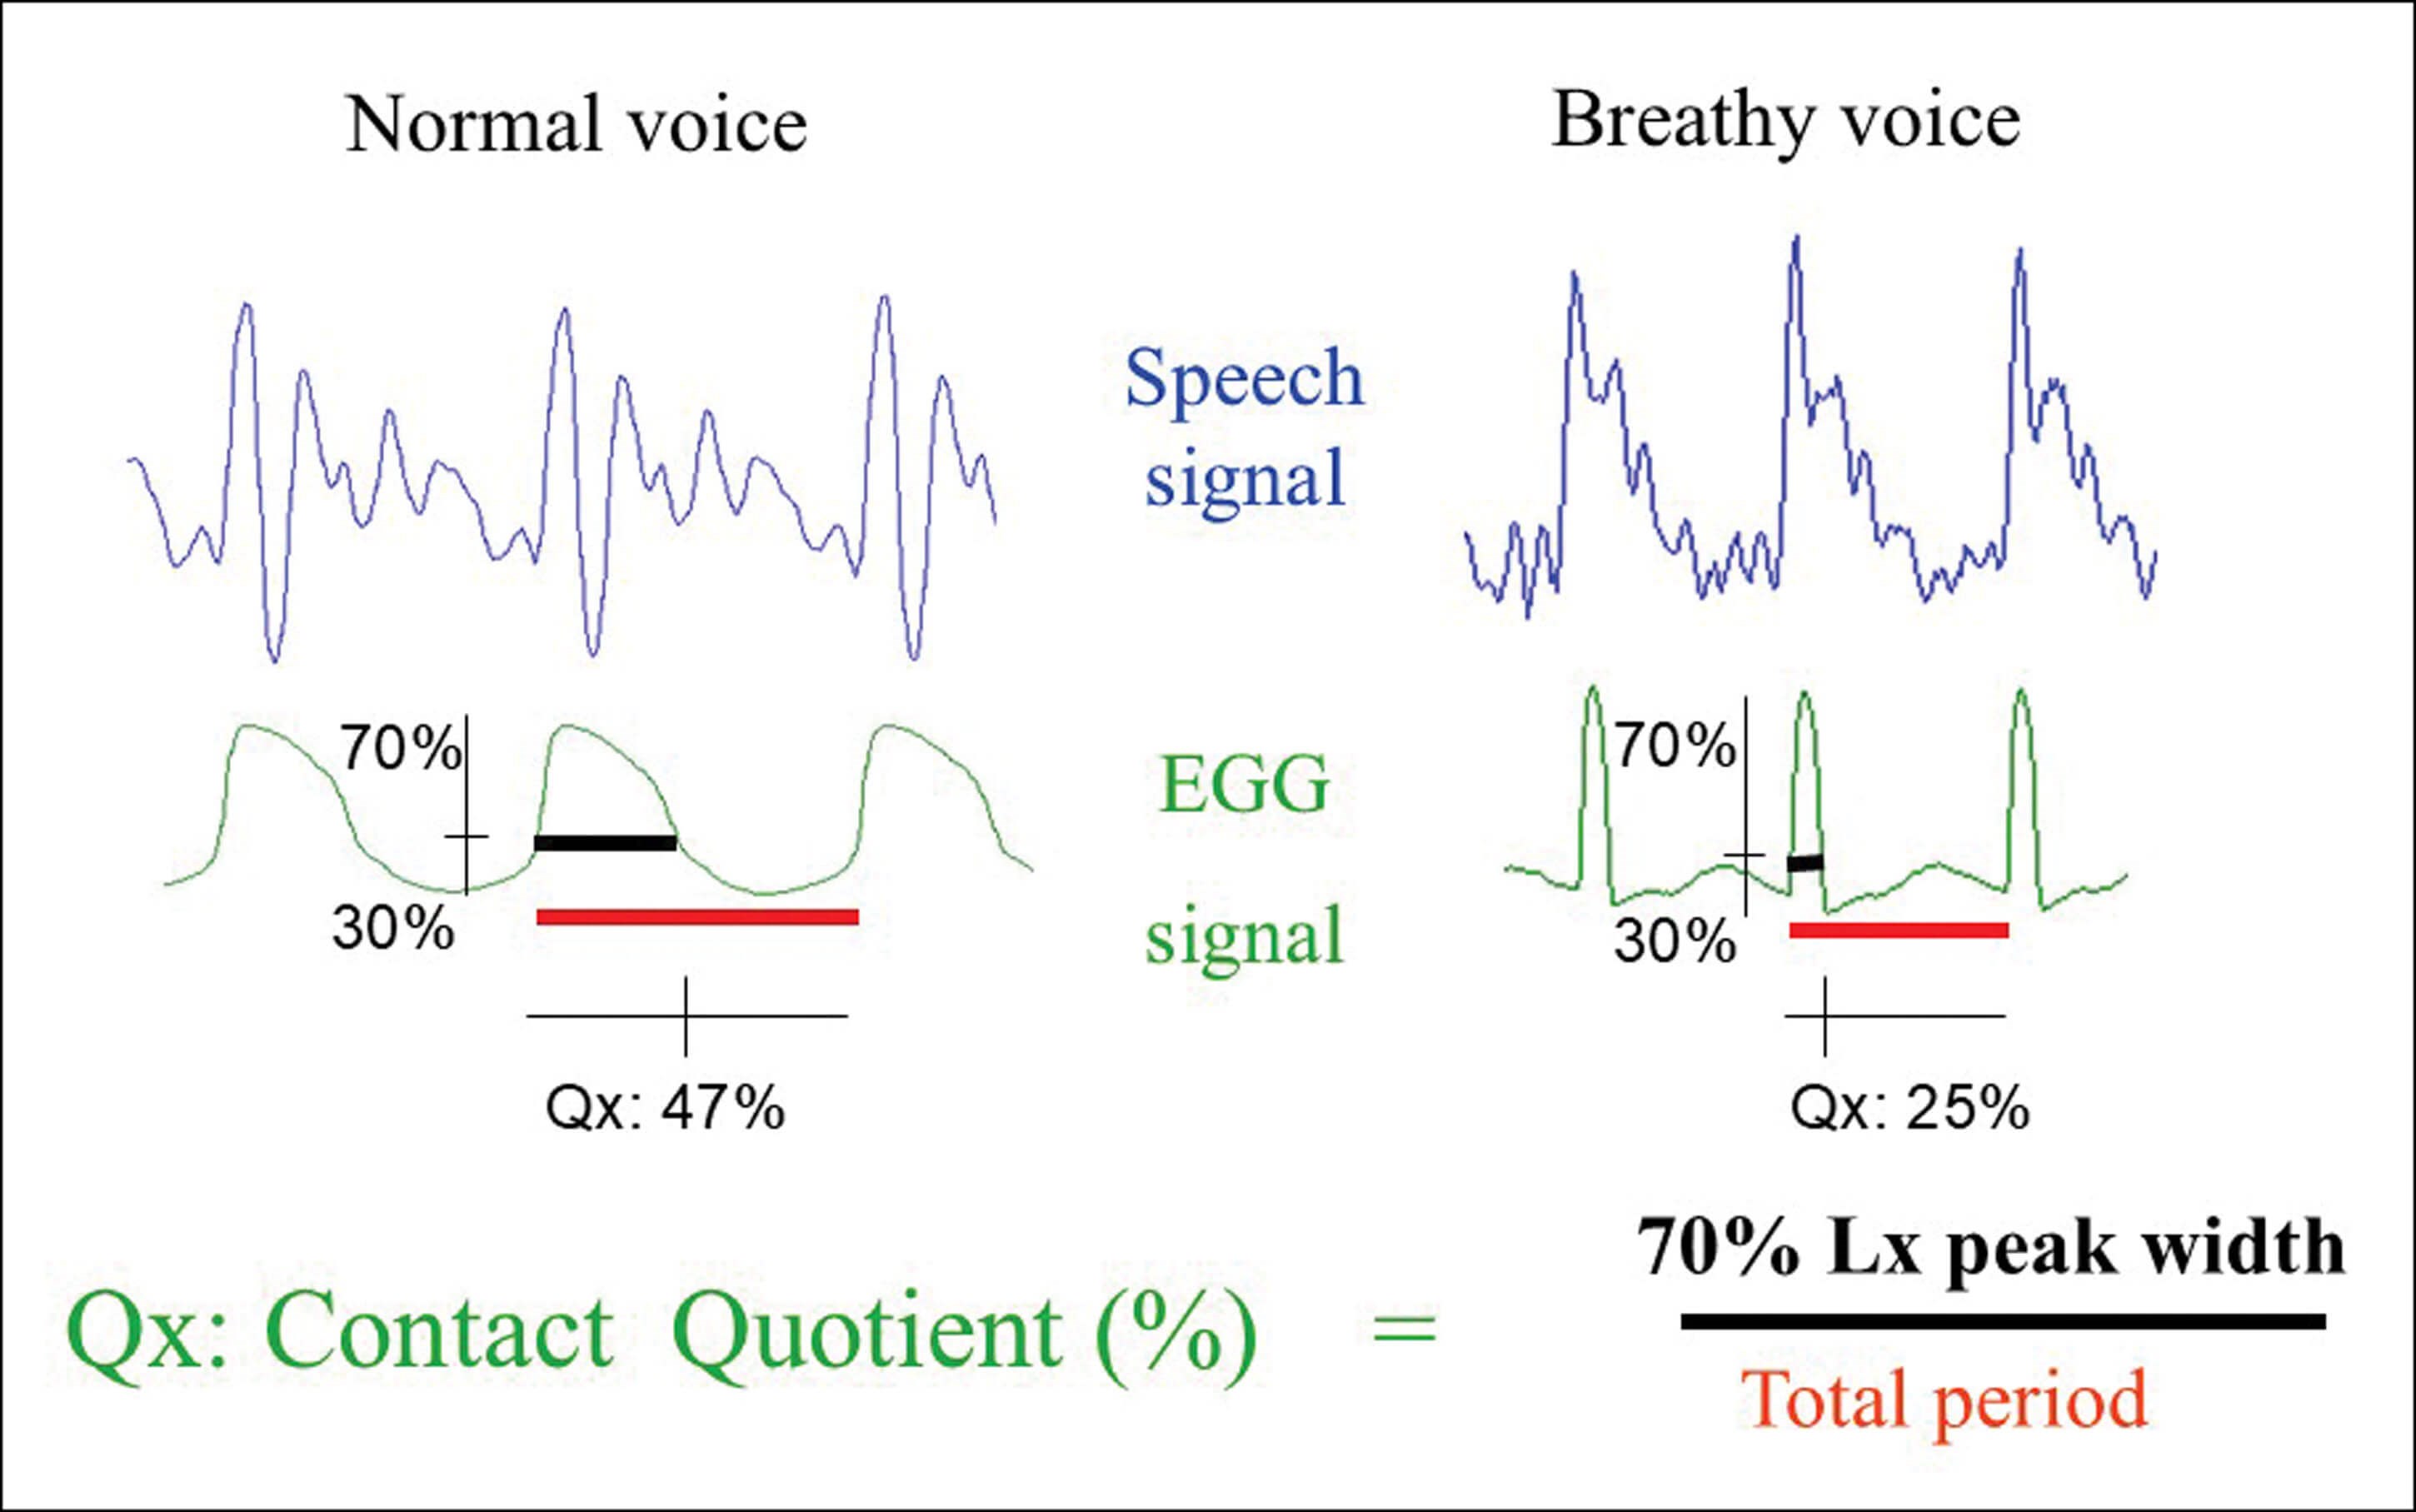
Figure 1: EGG and acoustic waveforms showing the difference between ‘modal’ and ‘breathy’ voice. Frequency (Hz) = 1/time (ms) to complete one cycle. The contact quotient Qx is the ratio of the width (ms) of the waveform measured 70% from the peak divided by the period (ms) as a percentage.Image: With thanks to Adrian Fourcin.
Electroglottography
EGG is an underutilised adjunct to acoustic analysis in clinical practice for characterising voice disorders and measuring response to treatment. The frequency of vocal fold vibration (Hz), sometimes referred to as ‘Fx’ (as opposed to F0 derived from the acoustic signal), can be calculated from the resulting EGG waveform in both sustained vowels and connected speech. Analysis of waveform shape can also provide an indirect measure of the contact quotient (Qx%) between the vocal folds during phonation (Figure 1). Reduced values indicate glottal insufficiency (e.g. recurrent laryngeal nerve palsy/paresis), while increased values may indicate pressed phonation (e.g. muscle tension dysphonia and adductor laryngeal dystonia) or increased vocal fold mass (e.g. Reinke’s oedema).
A distinctive feature of EGG-derived data, for example from Speech Studio (Laryngograph®), is the range of measures available from connected speech. Parameters such as Qx%, mean speaking fundamental frequency (SFx)~~ (Hz)~~, frequency range (octaves) and loudness (dB) can be displayed as histogram plots. A graphical representation of the frequency distribution (DFx1) shows the percentage of total vocal fold vibrations at each frequency across the range of spoken frequencies. Because at least two consecutive vibrations are required to be perceived as pitch, a second distribution (DFx2) of ‘pitch-carrying pairs’ can be overlaid.
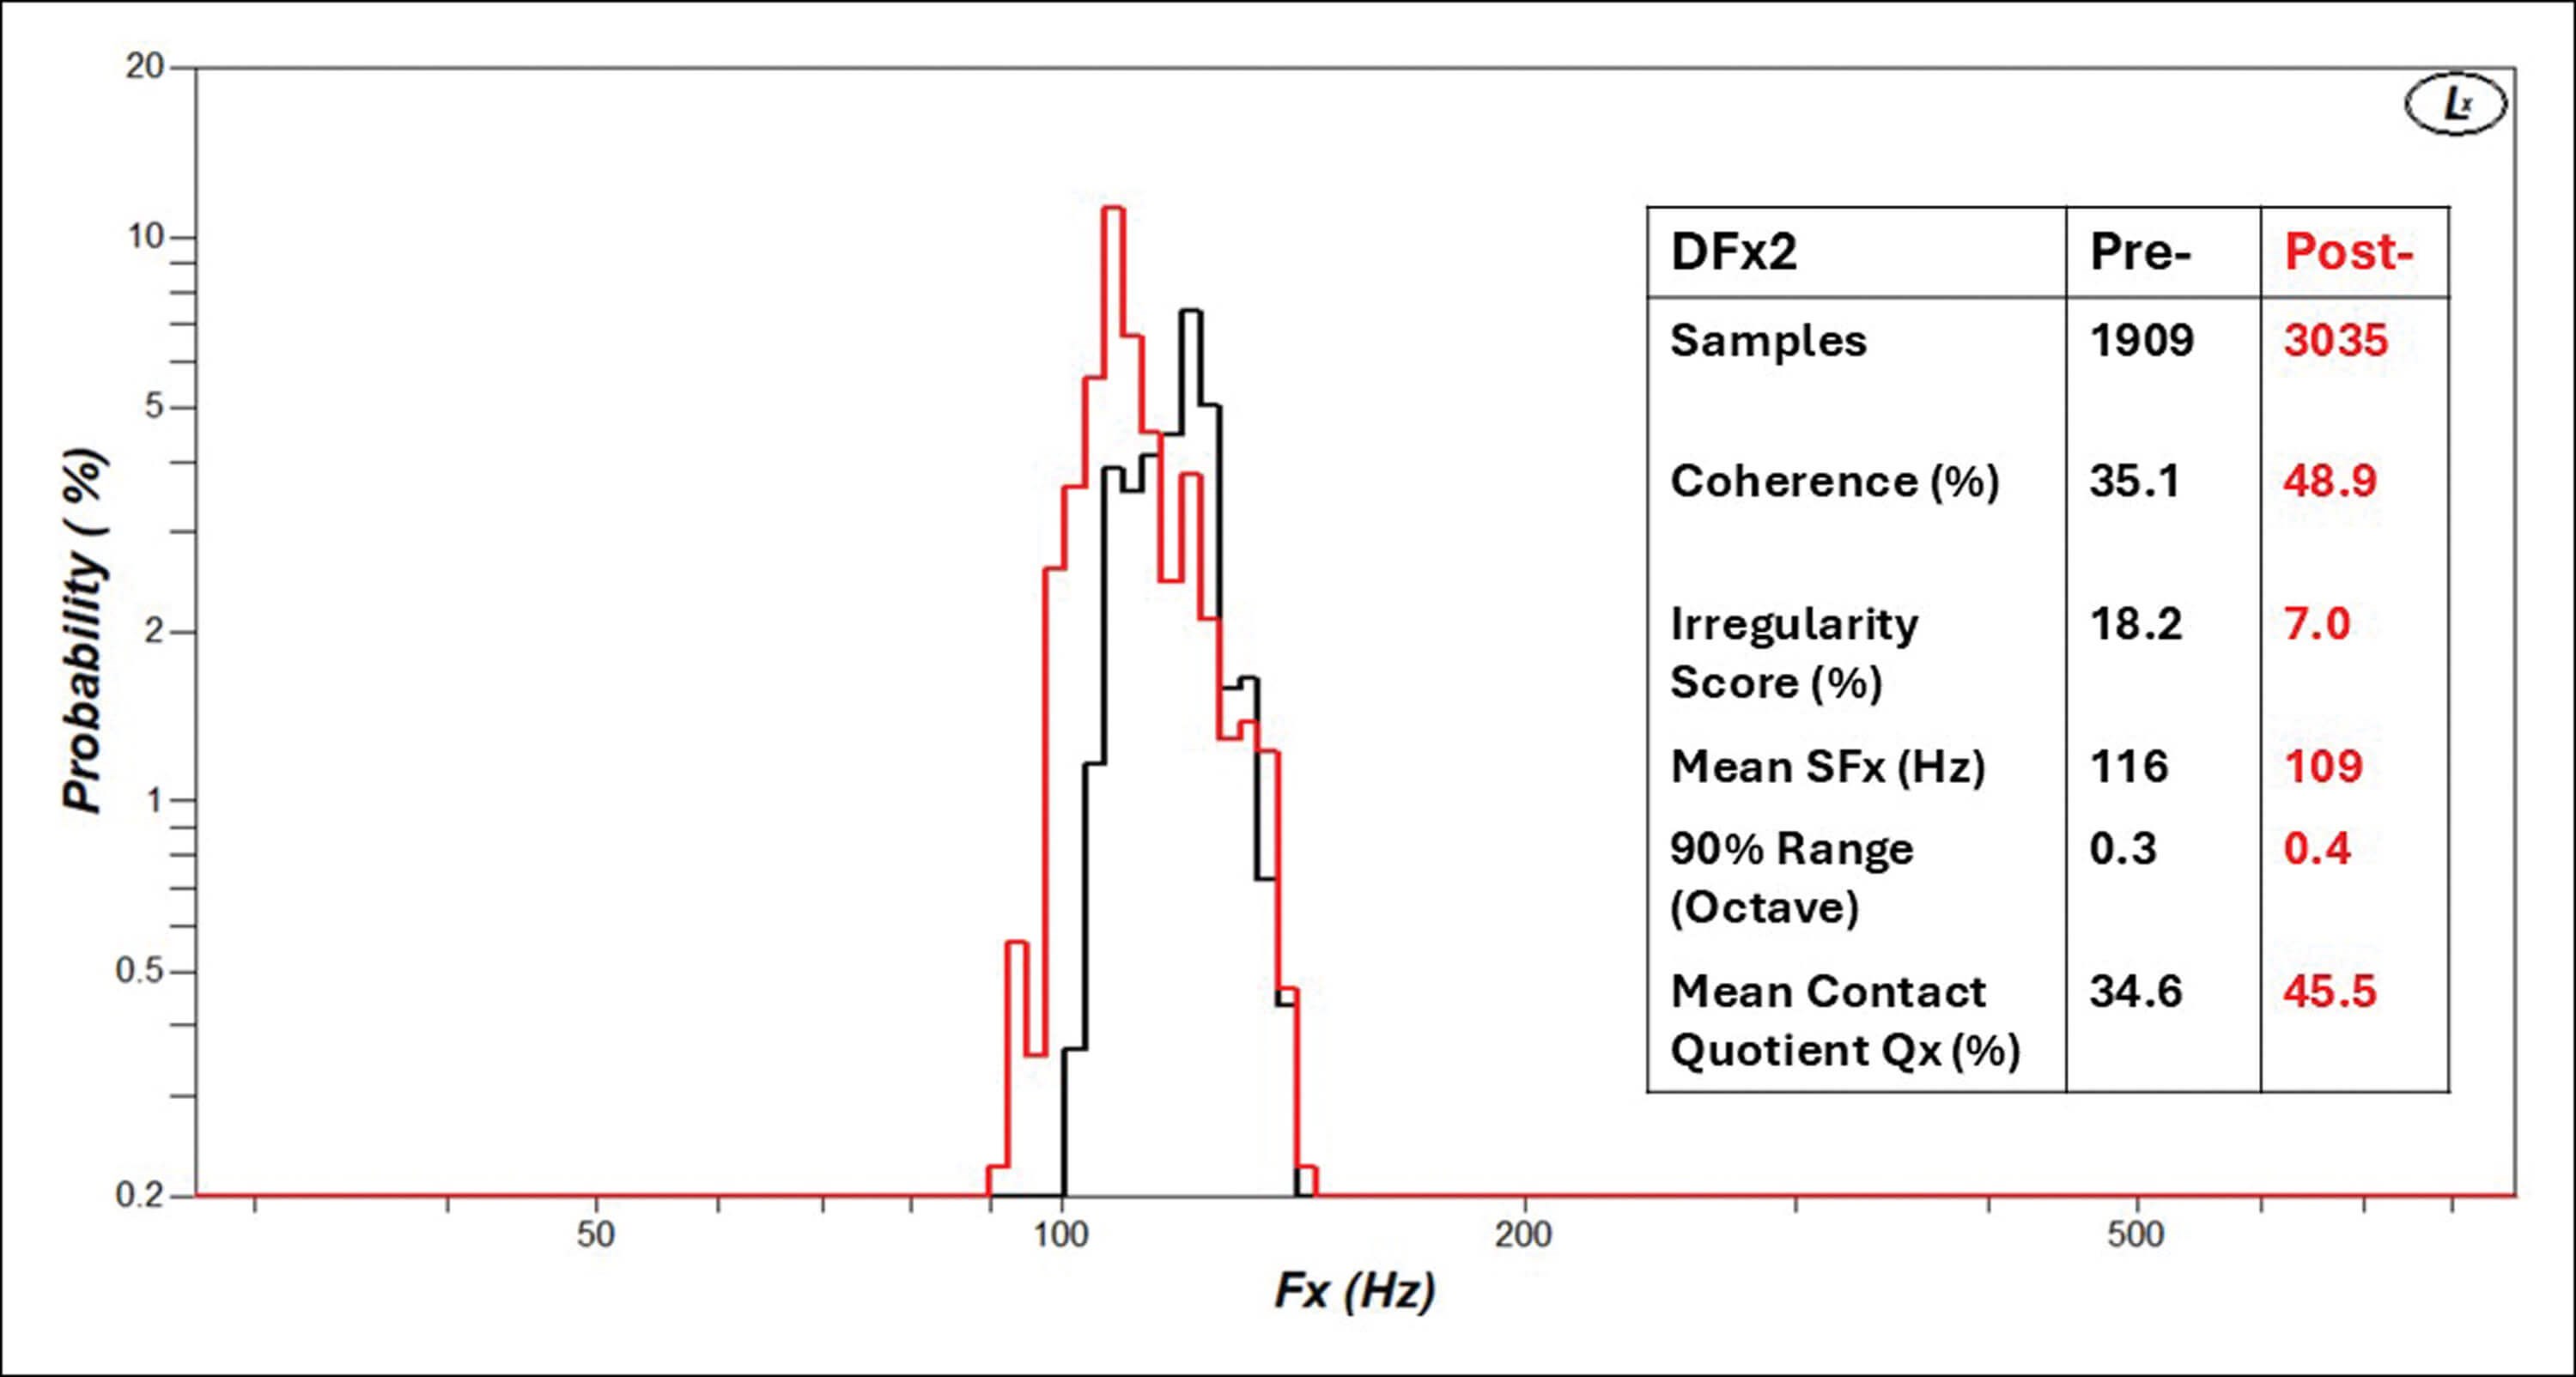
Figure 2: Illustrative DFx2 frequency distributions (53-year-old male, recurrent laryngeal palsy, pre- and post-thyroplasty) after reading ‘Arthur the Rat’ for two minutes. Note the increased number of samples, improved coherence %, decrease in irregularity score %, drop in mean speaking fundamental frequency, increased octave range especially in lower part, and visually improved structure of the histogram post-thyroplasty.
In good-quality speech, frequency changes smoothly with intonation, resulting in a greater number of frequencies represented in the DFx2 distribution. Conversely, in poor-quality speech, this number is reduced. A DFx2/DFx1 ratio provides a ‘coherence’ measure that can be used as an indicator of dysphonia severity and to monitor improvement in vocal fold vibration following treatment. Similarly, an ‘irregularity score’ (%) can be calculated by measuring deviation from the diagonal in sequential vibratory frequencies plotted against their predecessors, which can be interpreted as ‘jitter for speech’ [4]. An example of a DFx2 distribution for a patient pre- and post-thyroplasty is shown in Figure 2. When combined, EGG and acoustic measures provide a multiparametric assessment of voice with direct clinical relevance, although this has not yet been rigorously evaluated for clinical utility.
Artificial intelligence
AI approaches to voice analysis have the potential to support screening and early detection of voice pathology and other underlying medical conditions, as the voice is increasingly recognised as a biomarker of health and disease [5]. It has been used in the identification of cardiopulmonary, neurodegenerative and mental health conditions, binary classification of pathology versus no pathology, and differentiation between various laryngeal pathological conditions. Advanced algorithms, including machine learning (ML) and deep learning (DL) techniques, analyse acoustic, prosodic and linguistic properties of speech. Using a range of acoustic features, automatic assessment of voice quality using ML is producing near-expert agreement with perceptual ratings [6]. Voice pathology detection rates are generally around 90%, but none are yet ready for use as an aid in clinical assessment. However, as in many fields, AI is expected to transform voice assessment in the future.
Conclusions
Objective measures of voice remain an essential goal, but there is no universally agreed method. Traditional acoustic measures have been used in research but have not been widely adopted clinically, as they are time-consuming and have been largely based on sustained vowels, and are of questionable relevance to patient complaints and perceptual analysis. EGG methods provide practical, clinically relevant measures to support diagnosis and monitor post-treatment changes, but are not widely used. Multiparametric measures, which utilise CPP/CPPS from both sustained vowels and speech, have shown improved correlation with dysphonia severity. They are gaining popularity, particularly as some apps are freely available on most smartphones and are relatively quick to use. Further improvement is gained by combining these measures with patient questionnaires. Like all measures, however, they assess the patient at one point in time and do not account for voice variability with use. AI techniques are already reaching levels of near-expert agreement in assessing dysphonia severity. However, poor-quality recordings and inherent patient factors such as normal variation in voice use, accents and language differences may lead to erroneous results and reduce their effectiveness. There are also potential ethical issues related to recording, storage and fraudulent use of speech biomarkers. Larger clinical datasets may be required for training, but AI is expected to transform acoustic analysis.
References
1. Fujiki RB, Thibeault SL. Examining Relationships Between GRBAS Ratings and Acoustic, Aerodynamic and Patient-Reported Voice Measures in Adults With Voice Disorders. J Voice 2023;37(3):390–7.
2. Heller Murray ES, Chao A, Colletti L. A Practical Guide to Calculating Cepstral Peak Prominence in Praat. J Voice 2025;39(2):365–70.
3. Fantini M, Ciravegna G, Koudounas A, Cerquitelli T, Baralis E, Succo G, et al. The Rapidly Evolving Scenario of Acoustic Voice Analysis in Otolaryngology. Cureus 2024;16(11):e73491.
4. McGlashan J. Evaluation of Voice. In: Watkinson JC, Clarke RW, editors. Scott Brown’s Otorhinolaryngology Head and Neck Surgery. 3. 8 ed: CRC Press 2018.
5. Pedersen M, Nashaat NH, Camesasca V, Villoria RH, Das S. Voice-related Biomarkers (Open Access). 1 ed: Springer Cham; 2026.
6. Au YC, Yan N, Ng ML. Automatic assessment of voice quality using machine learning. Logoped Phoniatr Vocol 2026:February, 1–18.
Declaration of competing interests: None declared.